
Debunking the myth that deforestation in avoided-conversion carbon projects is guaranteed. An analysis of why probability modeling—not assumptions—is essential for credibility and high-integrity forest carbon credits.
See an ExampleReading time: 5-7 minutes
The carbon market has a problem: many projects claim credit for stopping emissions that were never really going to happen. Major investigations by The Guardian and Bloomberg exposed what industry insiders already knew: some forest protection projects, like the infamous Kariba project in Zimbabwe, were protecting forests that weren't actually at risk.
The result? Trust collapsed. Buyers abandoned "avoided emissions" projects and rushed toward carbon removal projects instead. Companies building carbon portfolios found themselves facing deep scrutiny from executives, investors, and customers about their carbon investments. Even Science-based Targets, a major climate initiative, avoided “Avoided Deforestation” projects as a path to net zero.
But ask those same carbon market veterans today, at the end of 2025, and you'll hear something different (at least off the record). The latest updates to Science-based Targets are starting to make room for avoided emissions in a net-zero portfolio. Most sustainability leaders admit that carbon removal alone can't scale fast enough to meet our climate needs. When done right, nature-based avoidance projects can deliver more climate impact per dollar than many removal projects. The key phrase: when done right.
The core challenge: defending the counterfactual. What would actually happen to this forest if your carbon project didn't exist?
This is the additionality question, and it's harder to answer than it sounds.
When many avoided conversion (Grasslands, Forests CAR, City Forest) carbon protocols are implemented without modification, they generally work like this:
Sounds logical. If the land would obviously be logged or developed without intervention, preventing that activity creates real value. This approach has merit—after all, market forces and economic pressures are real. Many forests genuinely face conversion pressure.
The problem? This formula assumes the baseline scenario will definitely happen, and that you know exactly when it will happen. It treats probability as 100%, even though the deforestation activity hasn't occurred yet.

Here's a thought experiment: If deforestation were truly certain, why hasn't it happened already?
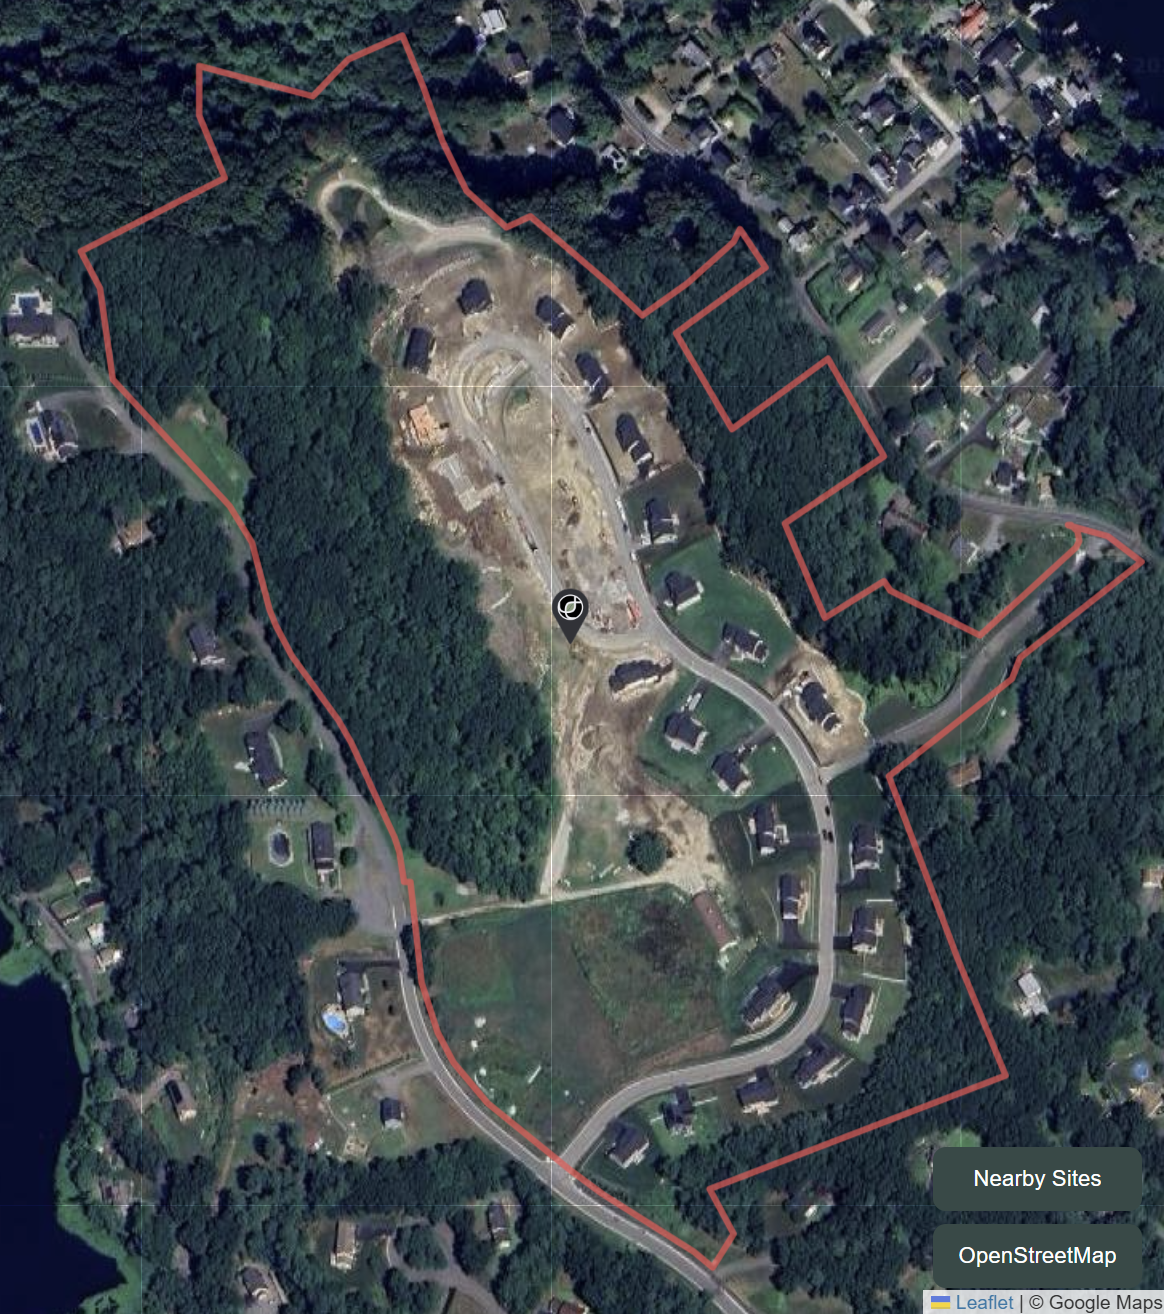
When you track a dynamic baseline of sites (similar forests that didn't get carbon project protection) over 40 years, reality shows up. Some get logged or developed. But many don't. If only 1 out of 3 baseline sites actually experiences development, the true probability was only 33%—not 100%.
The math problem: If you bought carbon credits assuming 100% probability, but the real probability was 33%, then two-thirds of your credits are worthless.
The financing problem: If you rely on ex-post dynamic baselines alone to fund a carbon project, that requires waiting 10 years after the project starts to observe the project's performance. Waiting 10 years to assess impact hinders essential early-years implementation investment - with uncertain baseline outcomes, most projects can't front half of the fair market value of real estate for a decade.
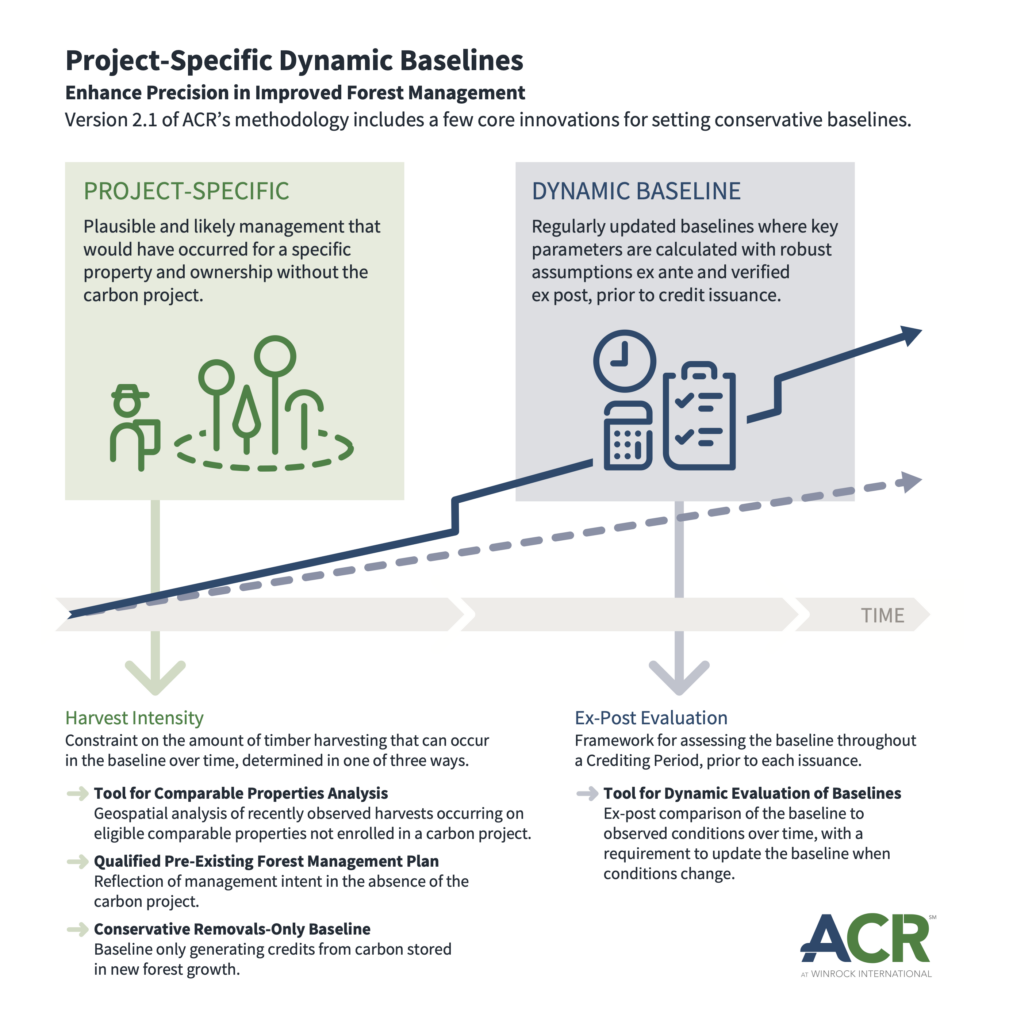
Verra's traditional REDD+ protocol actually prescribes an approach to modeling this probability, which they call "Likelihood of Deforestation", by using a the deforestation rate of the trailing 5 years from a suitable representative sample of sites. However, the single biggest structural vulnerability in Verra's system has been manipulation of the “suitable representative sample” (the reference region). This is widely recognized in independent academic reviews and was one of the main reasons Verra is replacing these methodologies with risk-map–based baselines (VM0048). Meanwhile, ACR's Active Conservation of US Forestlands provides a probability-based framework according to third-party land appraisals. Both of these are steps are in the right direction, and they have great room for improvement.
A credible project should seek to model the dynamic baseline before the project starts. That means:
Think of it like weather forecasting. Saying "it will rain" is different from "70% chance of rain." Every carbon project should provide a probability as context.
🔍What to look for: Data-driven statistical models with documented methodology, not assumptions or landowner intentions.
🚩Red flag: Statements like "The landowner has drafted plans to develop this site" without probability modeling.
✅ Best practice: Projects should use binary classification models, matched site comparisons, or peer-reviewed threat assessment models with quantified probability ranges (e.g., "15-22% deforestation probability based on 500 matched sites over 10 years").
🔍What to look for: Specific percentages with sample sizes and observation periods (e.g., "18% of 200 reference sites experienced conversion over 5 years").
🚩Red flag: No empirical tracking of similar sites over time, or inability to provide historical data on reference site outcomes.
✅Best practice: Dynamic baselines that monitor control sites throughout the project period and adjust crediting accordingly.
🔍What to look for: Regular monitoring schedules, transparent methodology updates, and temporal distribution of baseline events showing when activities occur.
🚩Red flag: Retroactive baseline creation, cherry-picked reference sites, or baselines calculated only at project start without ongoing validation.
✅Best practice: Annual or biannual monitoring reports showing baseline site conditions, with methodology adjustments documented and credit calculations updated accordingly.
🔍What to look for: Probability adjustments in credit calculations (e.g., "Credits discounted by 40% to reflect sites where no conversion occurs").
🚩Red flag: All credits assume 100% certainty that the threat would have occurred without the project.
✅Best practice: Conservative crediting that applies empirically-derived probability factors, ensuring credits represent only actual avoided emissions rather than worst-case scenarios.
🔍What to look for:
🚩Red flag:
This is Part 1 of a 5-part series examining common mistakes with additionality calculations for avoided emissions projects like Avoided Deforestation. Next: Black Box Baselines